Building a Map with React, SVG and D3.js
Motivation
Not too long ago, there was the pretty exciting and much heated US presidential election going on. And if you Google about the topic during that time, you'll see a map showing the realtime election result by states. I'm pretty sure, most of you would have recalled that. And yes, that map was actually built using SVG too if you inspect the document 😛
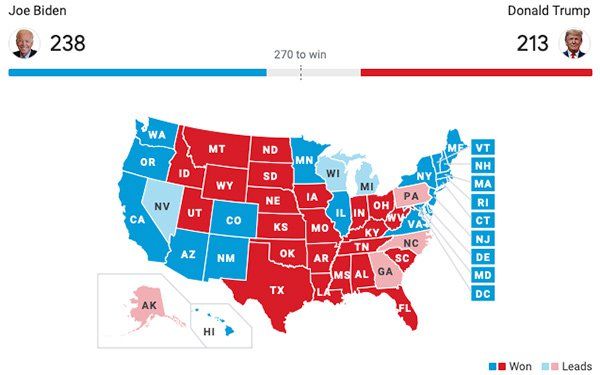
With that, I have taken an interest in diving deeper to explore the map visualization for web applications, i.e. using SVG in particular. Since I am a coffee lover, I thought building something along that line would give me more motivations!
Introduction
And so, I have decided to embark on the journey to build a simple world map, visualizing the distinct coffee taste profiles across different regions in the world. The demo application is currently hosted here. And the full source code can be found here on GitHub. It is written using React.
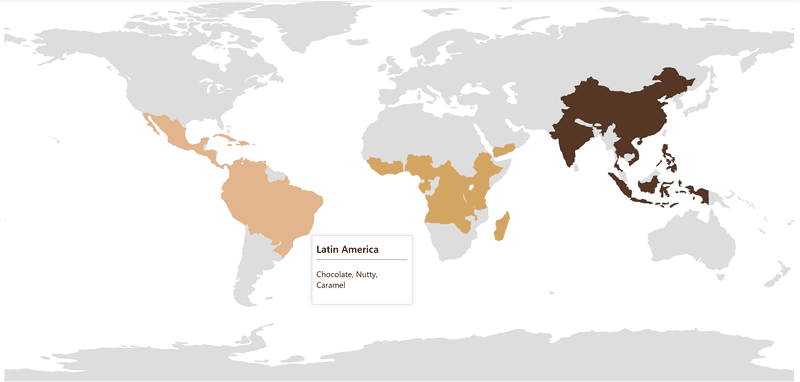
In this article, I am going walk you guys through the steps that I have taken to build this application.
Topics Coverage
Please feel free to skip to the sections of your interest.
- Overview
- Getting Coffee Producing Countries Data
- Getting Map Shapefile
- Converting Shapefile to GeoJSON
- Building Web Application with React + D3.js
1. Overview
There are 2 parts of data required to build this application.
- List of countries producing coffee (Wikipedia)
- World map shape information (Natural Earth Data)
Basically, it is all about scraping and transforming these data into formats readable by our application. Then, wrapping it up with React. Nothing more, nothing less! The diagram below pretty much sums it all up.

Okay! Let's get to work!
2. Getting Coffee Producing Countries Data
We are going to highlight only countries that produce coffee in the world. So first, let's hunt down this set of data.
We will be taking the data from Wikipedia. However, it is a web page and so, we need to do a little bit of web scraping to transform it into a JSON, that is consumable by our web application.
Here, I chose to do the web scraping chore using Python, i.e. Jupyter Notebook in particular. It is actually my first few attempts in trying to use Python. Haha.. Have heard so much about Python being a great scripting tool all these while. Finally, got my hand dirty with it (just a lil bit though).
First, head to https://jupyter.org/install. Follow the instructions to install Jupyter Notebook. It is a nice Python client tool that runs on browser to execute scripts. As a Python noob, erherm.. I mean Python beginner, I find it very intuitive and easy to use!
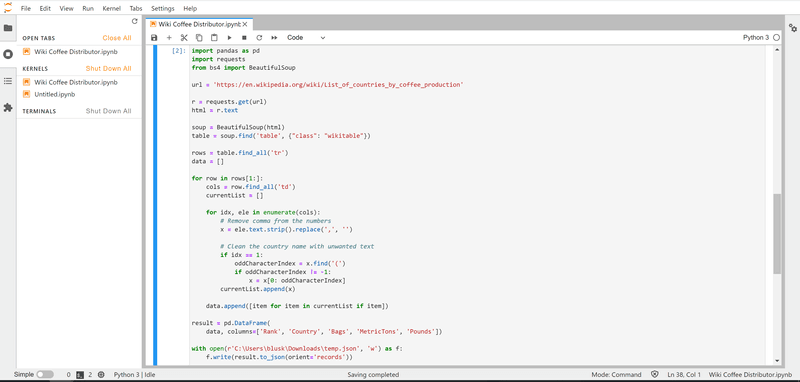
After spinning up the Jupyter Notebook, I executed the following script to scrape the data from Wikipedia. You will hit some errors complaining that the modules required are not installed. Just Google that up a bit to install the modules required.
1import pandas as pd
2import requests
3from bs4 import BeautifulSoup
4
5url = 'https://en.wikipedia.org/wiki/List_of_countries_by_coffee_production'
6
7r = requests.get(url)
8html = r.text
9
10soup = BeautifulSoup(html)
11table = soup.find('table', {"class": "wikitable"})
12
13rows = table.find_all('tr')
14data = []
15
16for row in rows[1:]:
17    cols = row.find_all('td')
18    currentList = []
19
20    for idx, ele in enumerate(cols):
21        # Remove comma from the numbers
22        x = ele.text.strip().replace(',', '')
23
24        # Clean the country name with unwanted text
25        if idx == 1:
26            oddCharacterIndex = x.find('(')
27            if oddCharacterIndex != -1:
28                x = x[0: oddCharacterIndex]
29        currentList.append(x)
30
31    data.append([item for item in currentList if item])
32
33result = pd.DataFrame(
34    data, columns=['Rank', 'Country', 'Bags', 'MetricTons', 'Pounds'])
35
36with open(r'c:\your-directory-path....\temp.json', 'w') as f:
37    f.write(result.to_json(orient='records'))
38
This python codes basically scrape that Wikipedia page's table, transforming it into json format and save to a local directory "c:\your-directory-path....\temp.json". After that, I transfer the file into my React project for later usage. It actually in the assets folder in my repository.
3. Getting Map Shapefile
Next, we need to download the Shapefiles of the world map. This can be found at https://www.naturalearthdata.com/downloads/
The shapefile format is a geospatial vector data format for geographic information system (GIS) software
https://en.wikipedia.org/wiki/Shapefile
There are 3 sizes available for you to download, i.e. Large, Medium, Small. For the purpose of this experiment, the Small size will suffice.
4. Converting Shapefile to GeoJSON
GeoJSON
Next step would be to transform the shapefile that we have downloaded in Step 3 into GeoJSON. It is basically a json file with a specific structure to describe the geographical information. The formal specifications can be found here https://geojson.org/
JSON is our good friend here. It is the so-called "first class format" in JavaScript world and especially important since we are building a Web Application anyway, which ultimately requires JavaScript to be interactive in the first place. Do you know JSON is also known as JavaScript Object Notation? Haha..
QGIS
There are various ways to transform the shapefile into GeoJSON. Here, I opted for QGIS. It is a very popular tool for viewing and editing geographical data. Also, it is open-source and well, free! Do consider to give them support for the wonderful works though.
It can be downloaded here https://www.qgis.org/en/site/
Alright, open up your QGIS!
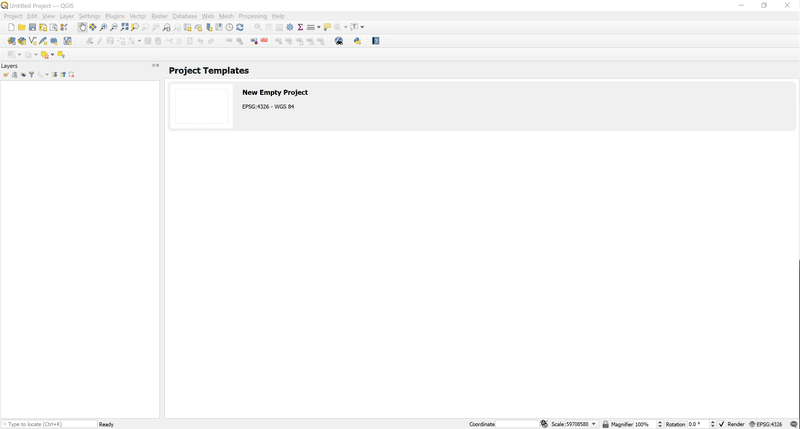
Next, unzip the Shapefile that you have downloaded from Natural Earth previously. Drag the shapefile, entitled ne_110m_admin_0_countries_lakes.shp and drop it onto the QGIS app. The map should be populated onto the app's workspace.
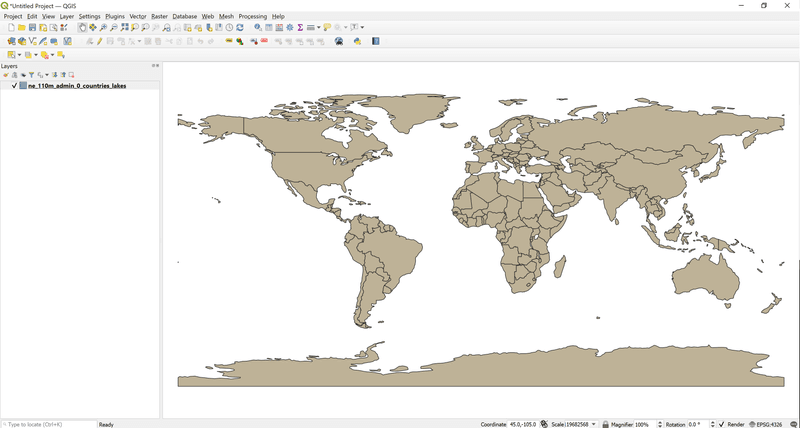
After that, right click on the vector layer on the left panel > Export > Save Features As...
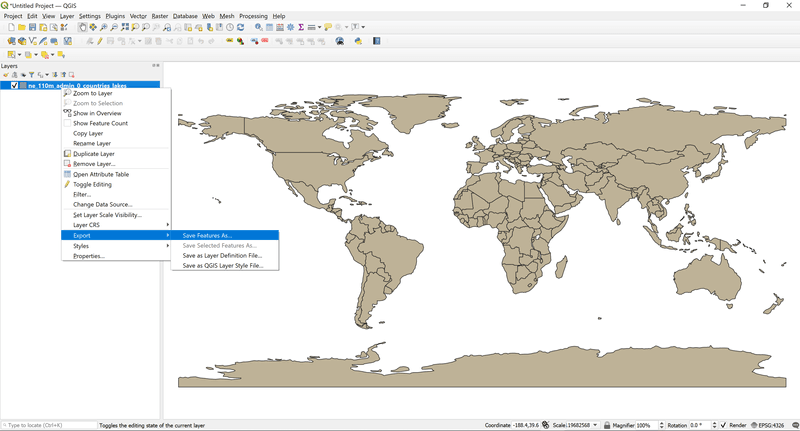
You should be getting the following popup or a dialog that looks similar. You can configure your export filename at section (1)
Section (2) is the selection of properties that you want to include in the GeoJSON file. For this experiment, I have included the following properties, i.e. ADMIN, ISO_A3, CONTINENT, REGION_UN, SUBREGION and REGION_WB.
I did not utilize all the properties exported here in the demo app, which brings us some food for thought. If you think about it, the less properties you exported here, the smaller the GeoJSON file will be exported. The smaller the file size, the lesser the time is required to download, which then translates to achieving higher performance on user end! So, only select properties that you really need for your application!
There we go, we have our GeoJSON file with us now. All that's left, is to build that Web Application with React and some help from D3.js.
Just for the record, I named the GeoJSON as world.json and put it here in the project's GitHub repository.
5. Building Web Application with React + D3.js
I won't go through all the codes in the repo. I will only point out the gist of making this app happening. For the full code, head over and have a look at the GitHub repository.
SVG
SVG stands for Scalable Vector Graphics. If we open an SVG file with a text editor like Notepad, Sublime, etc., we will find that the content is in XML format.
As such, it's a text-based, open Web standard for describing images that can be rendered cleanly at any size and are designed specifically to work well with other web standards including CSS, DOM, JavaScript, and SMIL. SVG is, essentially, to graphics what HTML is to text.
https://developer.mozilla.org/en-US/docs/Web/SVG
For this experiment, I am going to use SVG to draw the world map on the web app. All we need, is to convert the GeoJSON into SVG path tag's d attribute, the path definition. For that, we will need some help from D3.js.
Though it's possible to write some algorithms by yourself for the conversion, I would highly recommend otherwise as it's not worth the time and effort to reinvent the wheel! So... just get some helps from D3 😉 Unless you are a geek on those algo topics, then by all means!
D3.js
There is no secret that D3 is a very powerhouse library for building data visualization stuffs, though not only limited to that! Here is how I used D3 to convert my GeoJSON to SVG path definition.
I have encapsulated all codes that handle coffee data into a custom hook - useCoffeeData. The source is here. Alright, here are some coverage on the main points.
First, import geoEquirectangular and geoPath from d3-geo. Note that the import statement only import the functions that we need from the d3-geo package. This reduces the bundle size as opposed to import directly from d3 main package, which essentially import the whole of d3.
1import { geoEquirectangular, geoPath } from 'd3-geo';
2
Remember, always ONLY include things that you need! This rule hardly goes wrong in the world of programming, no matter which stack you're working on.
geoEquirectengular is one of the inbuilt projection method supported in D3. There are also other projection type supported such as Mercator (used in Google Map) via geoMercator method. The full list can be found in the doc here on D3's d3-geo GitHub repo. You can even write a custom projection method if you wish to!
Next, it's to create the path generator, with the projection as its input. Below is the snippet.
1const projection = geoEquirectangular().fitSize(mapSize, geoJson as any);
2const geoPathGenerator = geoPath().projection(projection);
3
Basically, the geoPathGenerator created here is a function that accepts GeoJSON's feature field as param, and return the SVG path definition.
We can then use the generator function to help us generate the SVG path definitions required.
1let svgProps: SVGProps<SVGPathElement> = {
2  d: geoPathGenerator(feature as any) || '',
3  stroke: defaultColor,
4  fill: defaultColor,
5}
6
That's all we really needed from D3 over here! It's the projection algo and the SVG path definition generations!
All that's left is to hook up the entire thing into our WorldMap component, add some interactions upon hovering different coffee regions. And that is pretty much a React side of thing already. No more magic here on out!
Here is a snippet of the WorldMap component. As you can see, we are just manipulating the svg and path tags here to populate the map and also handling the map hovering behaviors. Pretty much React alright! Haha..
1return (
2    <div className="WorldMap">
3      <div ref={tooltip} style={{ position: 'absolute', display: 'none' }}>
4        <Tooltip>
5          {tooltipContent}
6        </Tooltip>
7      </div>
8
9      <svg
10        className="WorldMap--svg"
11        width={mapSize[0]}
12        height={mapSize[1]}
13      >
14        {mapCountries.map(country => {
15          return (
16            <path
17              id={country.countryName}
18              key={country.countryName}
19              {...country.svg as any}
20              onMouseMove={(e) => handleMouseOverCountry(e, country)}
21              onMouseLeave={() => handleMouseLeaveCountry(country)}
22            />
23          )
24        })}
25      </svg>
26    </div>
27  );
28};
29
Conclusion
It isn't always necessary to use a full blown map library like MapBox, Leaflet, or even Google Map to build an interactive map in a web application.
Of course, this depends on the usage needs as well. If you require the control over street data for things like navigations, etc., opting for those library would naturally be the way to go. It doesn't make much sense to reinvent those GIANT wheels since there are already a bunch of top coders working on those already. Might as well, leverage the work and focus on your product development instead 😛
However, if we are only working on high level data visualization topics, say to have a heat map on the world population, etc. It would make perfect sense to work with only some SVGs to get things up and running. That way, you gain benefits like light weight, performance, controls, etc.
It was a fun little experiment hacking up a map using SVG in web application context. Though there are certainly more things to it like Python web scraping, QGIS on the generation of GeoJSON, etc. getting involved along the way, I thought it was a pretty fun experience altogether. Hey man, at least now I know some Python for real! hahaha...
Alright, closing off with some coffees here. See you on the next one!
